
Jennifer Truong
Data Analyst | Office Organizer | Lifelong Learner
About Me
Hello and welcome to my data portfolio!I transitioned to data analytics from a non-technical background (even though I worked in STEM for a few years). Understanding the "chaos" of data is what I strive to do, so if this is what you need help with, let's chat!I especially like to work with data cleaning and data visualization. Tools I have worked with before include Microsoft Excel, SQL, R, and Tableau.Curious? Check out some samples of my work on the next page!
Skills
Microsoft Excel, Google Sheets, MySQL, Tableau, Grafana, R- Database Management: 3+ years
- Data Visualization: 3+ years
Featured Projects
Tableau
Google Trends on "Scary Dreams"
Showing average Google search interest in the US on "scary dreams" as part of the weekly #MakeoverMonday data viz challenge.
Tableau
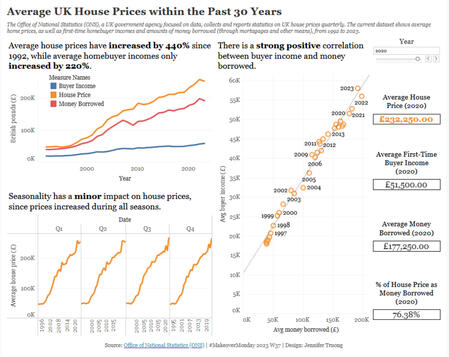
UK Home Prices
Focusing on average UK home prices within the past 30 years as part of the weekly #MakeoverMonday data viz challenge.
R (TIDYVERSE)
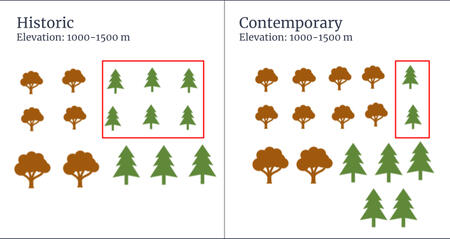
Master's Group Thesis - Forest Conservation
An academic report on forest condition changes in Southern California as a group thesis project for my master's program.
contact me
If you're interested in working together or having me join your data team, feel free to contact me using the links below!Otherwise, you can also check my LinkedIn and blog, where I post regularly about data!
tableau | Google Trends on "Scary Dreams"
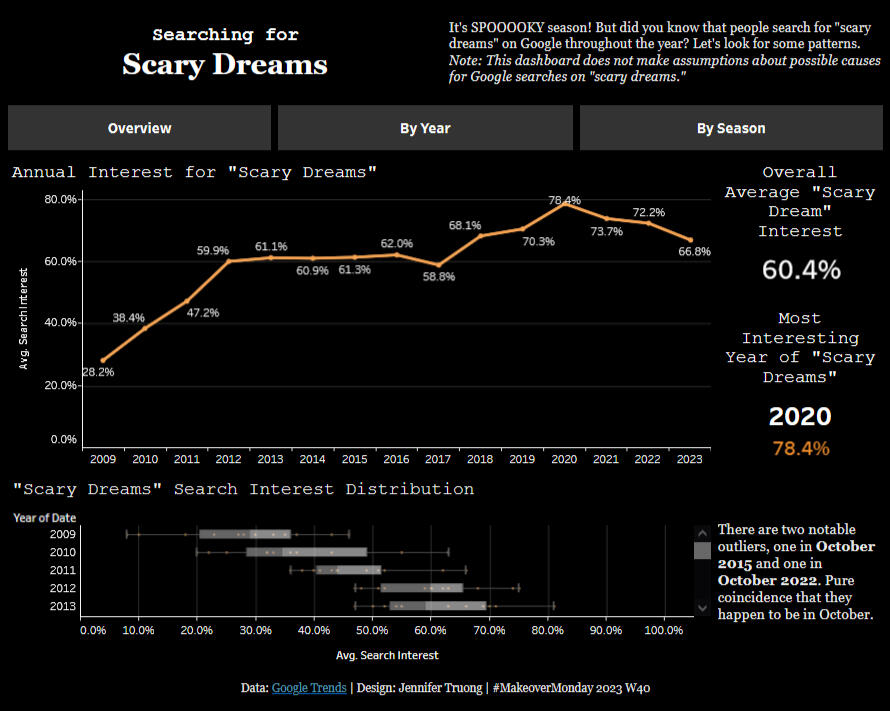
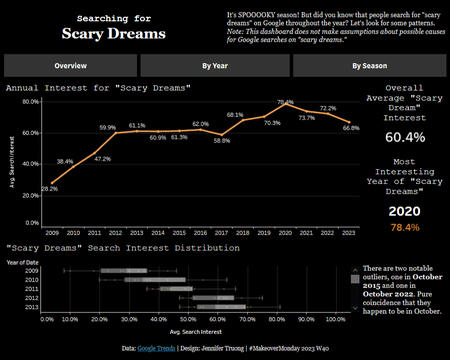
A Tableau dashboard examining Google search interest for the term "scary dreams" within the US from 2009 to 2023.
IntroductionIt's October, so it's time for the SPOOOKY season. Google Trends has a dashboard for tracking searches on the term "scary dreams." Why would someone look up "scary dreams" on Google? Who knows? While we can't make any assumptions, we can still explore interesting trends within Google's data.Questions to Explore1. What's the distribution of searches in scary dreams?
2. Does seasonality make an impact in searches for scary dreams?
3. Which year had the most amount of scary dreams?Tech Stack- Microsoft Excel (Power Query)
- TableauKey Takeaways- Most months have search interest between 55 and 80% for "scary dreams" (based on intial data exploration).
- The year with the highest search interest was 2020 with 78.4%.
- The season with the highest search interest was Fall 2020 with 83.3%.
- Seasonality may not have a huge impact on search interest compared to year.